Table of Contents
Overview and Problem
You have an application (for example a desktop application, an application running in baremetal IIS, a console application, a Windows Service, so on..) that is producing custom application logs, CSV, Kafka middle-ware or so, being stored in a flat file format in local file system (Activities, sign in logs, custom app ‘http’ logs, so on) that you would like to bring to Azure and create intelligent insights and alerting off of those logs.
An ideal scenario could be that logs containing application events from flat file, stored in a very specialized JSON/CSV format in a file folder (c:\logs\Logs-dd-mm-yyyy-xxx.txt), could be ingested into Azure Log Analytics workspace, and then visualizations, charts, alerting can be made out of this for operational readiness reasons of the applications team owning the application.
This is the final outcome. See the complete guide below. (image linked to larger image opens in new window)

Sample Application Logs
For the purpose of this guide, I have created a sample dataset with randomized values:
(link open in new window)
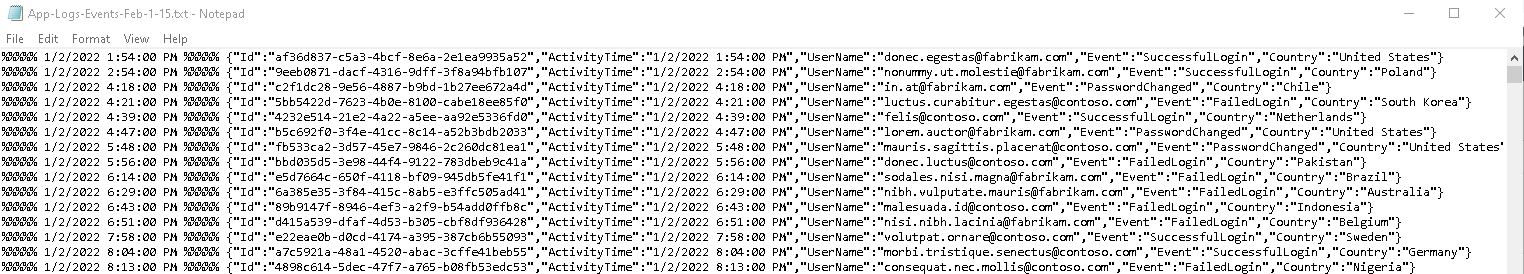
%%%%% 1/2/2022 1:54:00 PM %%%%% {"Id":"af36d837-c5a3-4bcf-8e6a-2e1ea9935a52","ActivityTime":"1/2/2022 1:54:00 PM","UserName":"donec.egestas@fabrikam.com","Event":"SuccessfulLogin","Country":"United States"}
Where it contains an activity time, event, user and the country columns. Notice that there’s a duplicate date time field in the beginning of this file under %%%%%. This will also make the row challenging to parse when dealing with it as JSON (that solution is towards the end).
Setting up Virtual Machine with Application Logs
In this step, essentially we want to capture the folder path where all the log files will be stored and are written by the application running on the system.
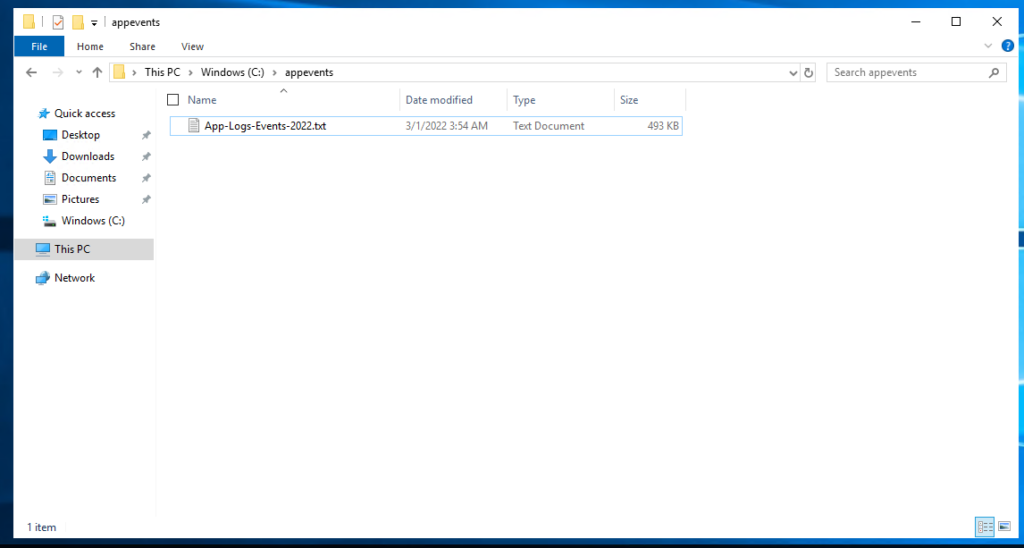
Folder captured from the virtual machine is c:\appeventsand essentially all the *.txt files within this folder.
Setting up Log Analytics Workspace
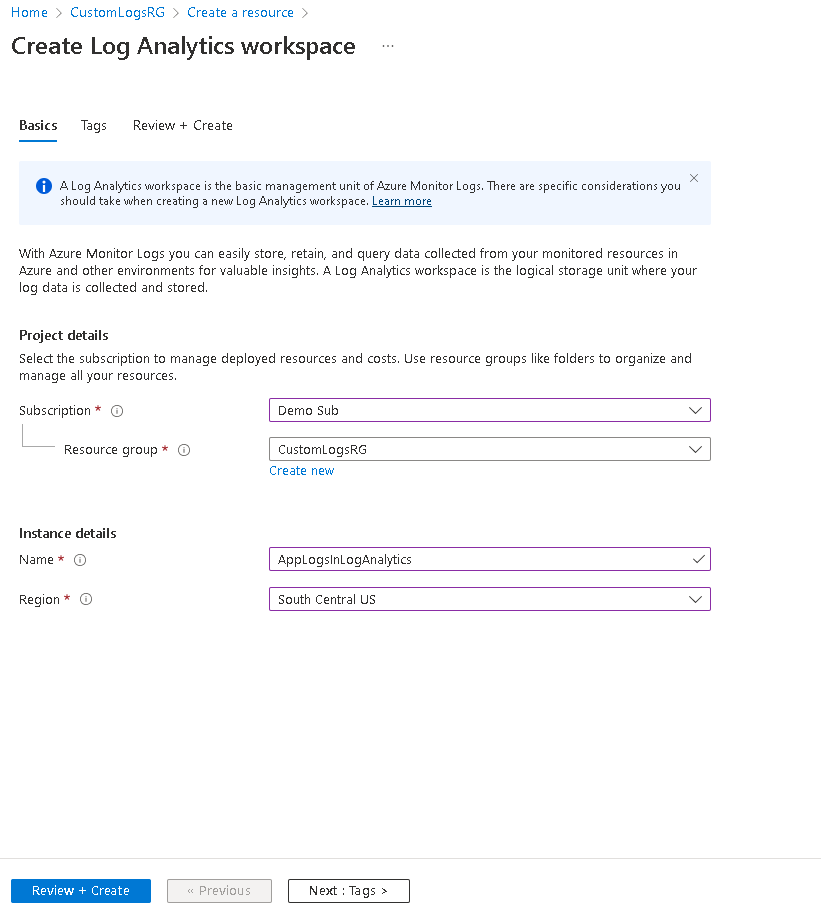
Create a Log Analytics workspace
Setting up custom log source
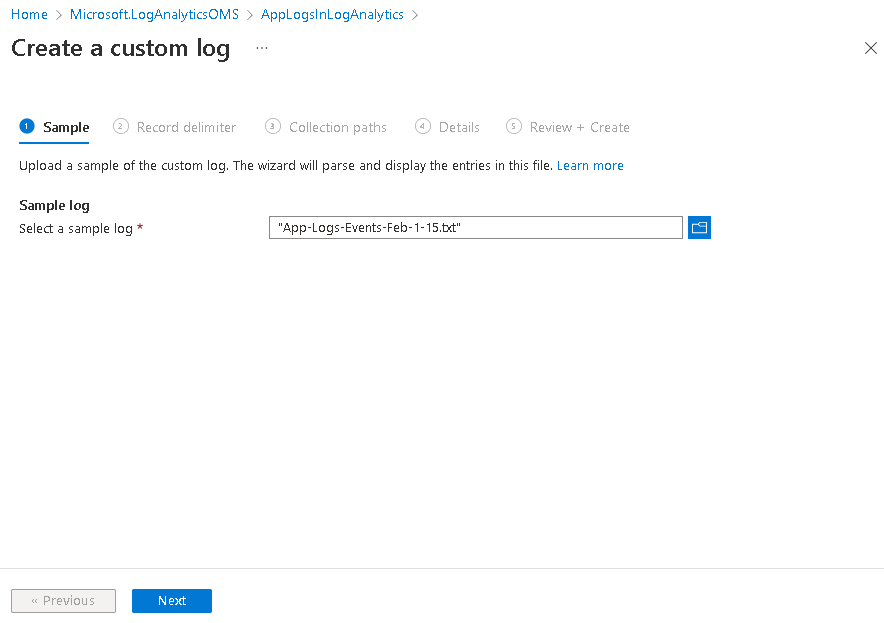
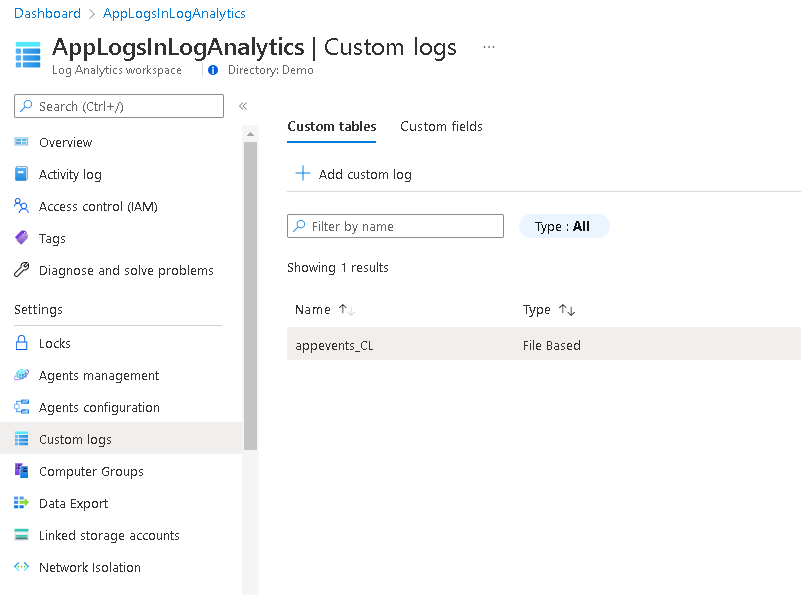
Go to ‘Custom Logs’ section in your new Log Analytics workspace. Click ‘Add custom log’

Specify a sample file out of the log files. It will be used to pre-parse it and create a preview out of the log file
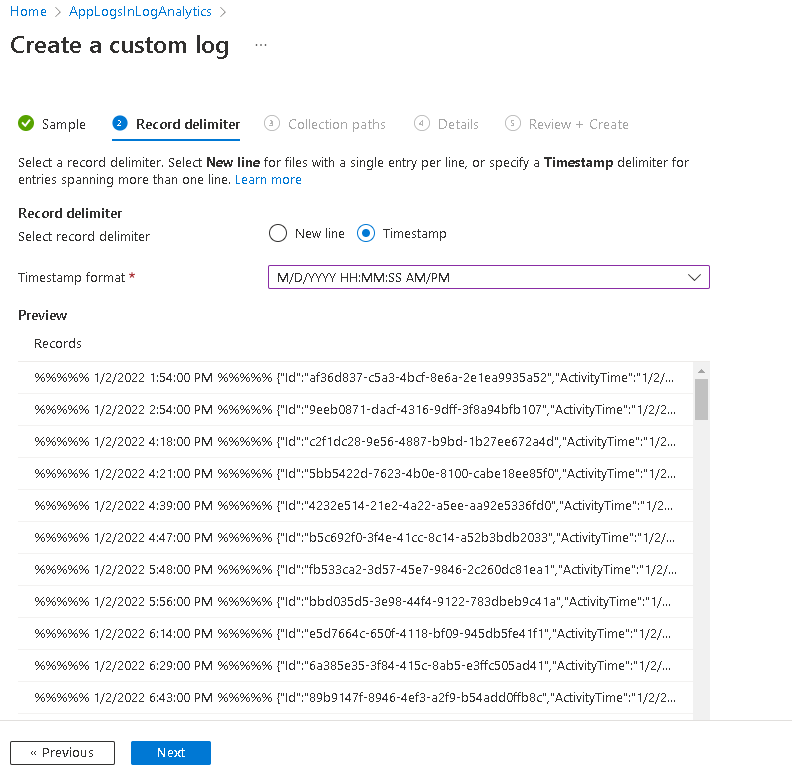
Specify how the records in the log file a deliminated. One nice feature is that you can use timestamp delimiter, so if your logs have 1 event spanning over multiple lines, for example containing a big stack trace, you can have it configured so it is considered 1 record.
TimeGenerated column is automatically added to your table and it’s value depend on what you select in this step. If you select [x] New line delimiter, then the column value will be the time this log was ingested. If you select [x] Timestamp (and let the custom log source parse your date time) then the value of TimeGenerated column will be equal to the value in your log event record from your text file. You will need to specify the format form the dropdown, so behind the scene it does RegEx search if your log file and find each event in log.
I chose Timestamp, because I want to take the date time value stored within my logs files to go to TimeGenerated column.
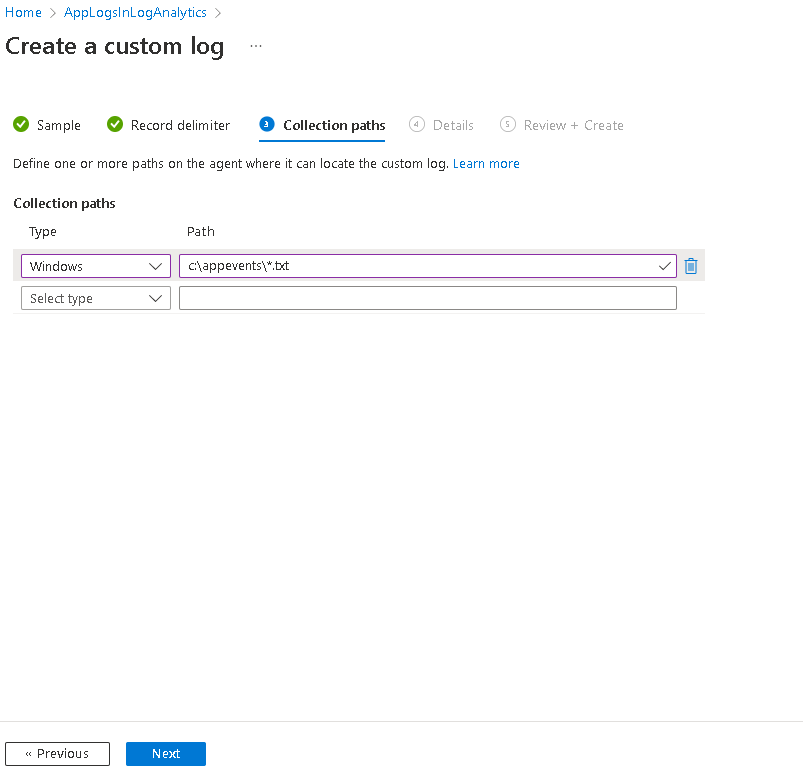
Over here we have to specify how the Azure agent will go and grab the files and from what path. We’re running Windows so I’ll select Windows from the first drop down. In the Path field, we’ll specify the path we captured in the first step. I’ll specify c:\appevents\*.txt which means that all the *.txt files within this folder.
Then give it a name. Notice that the _CL will be appended to the name you specify. This name will become the table name in your log analytics workspace.
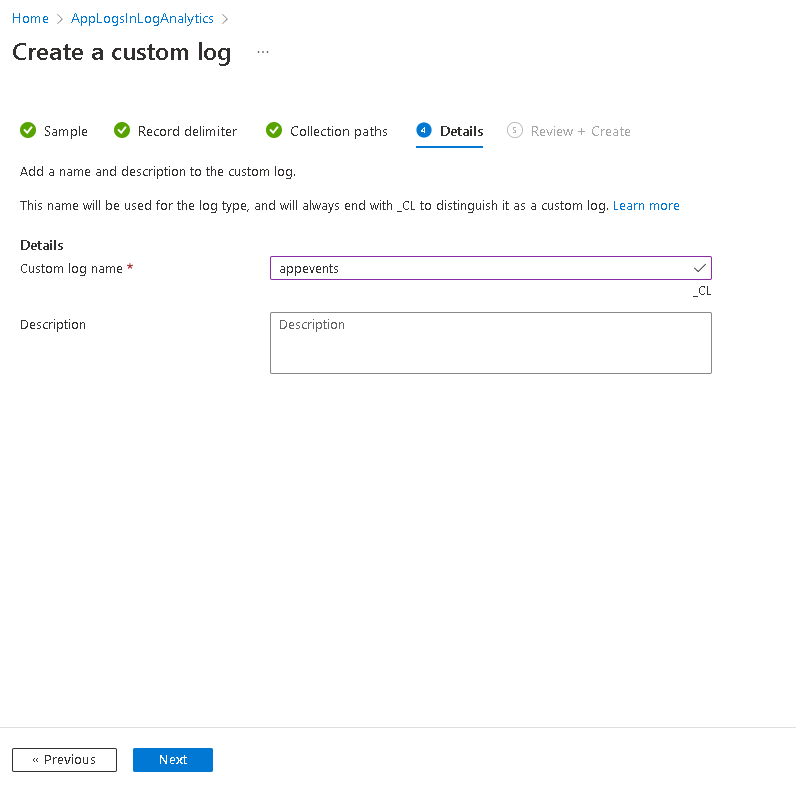
All good, click Create.
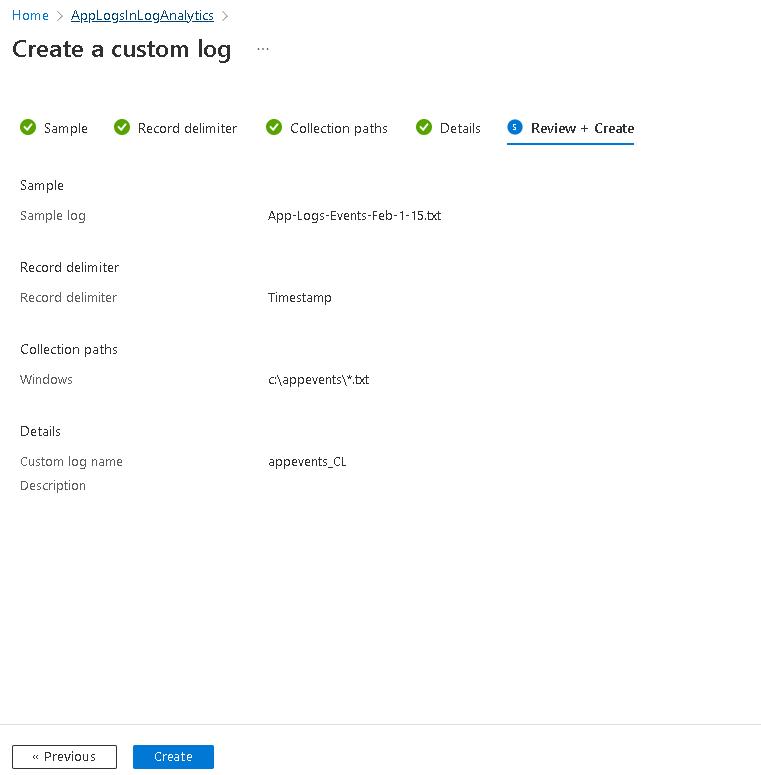
Once the Wizard is complete, it will show that a ‘custom table’ has been created.
Connect to virtual machine
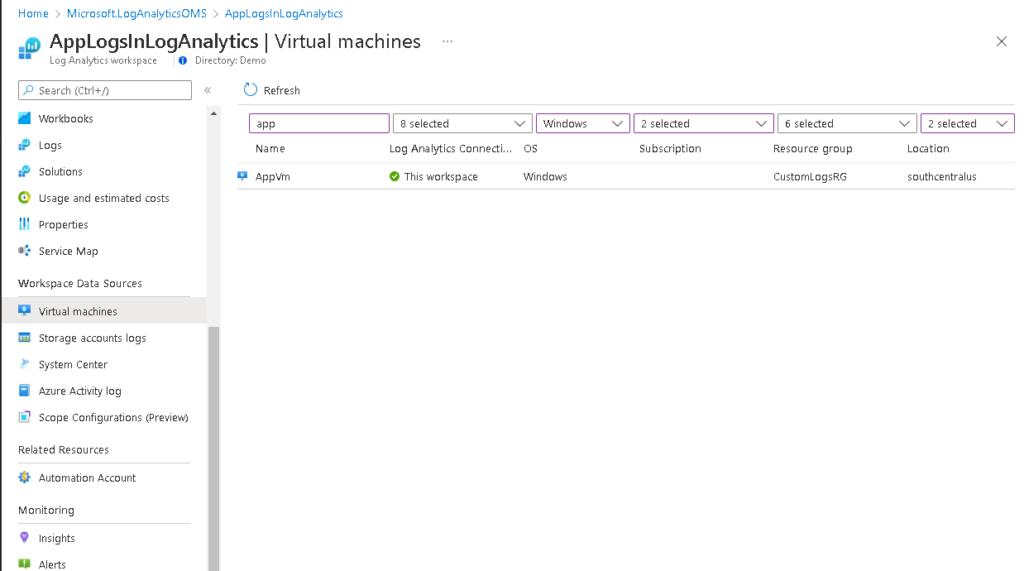
The next step is to connect our Log Analytics workspace to the Virtual Machine containing our logs.
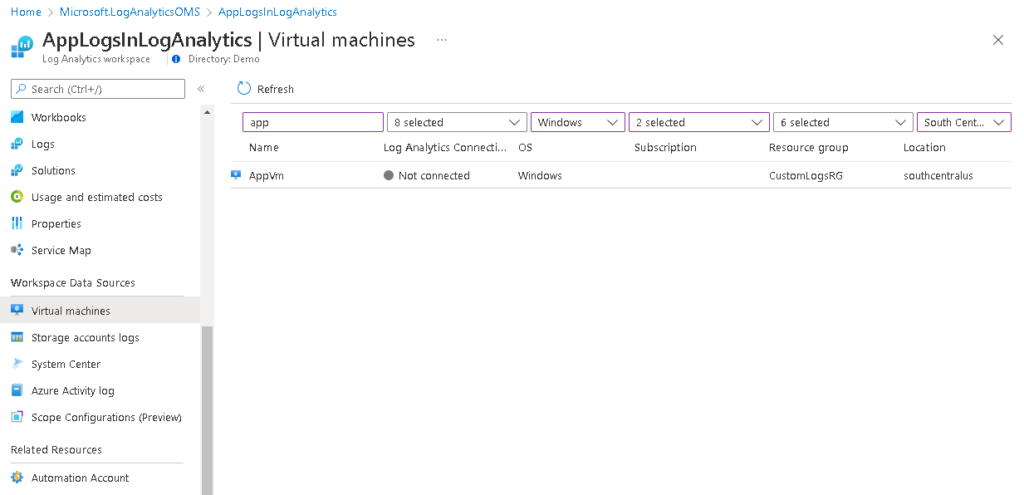
In Log Analytics workspace, under Workspace Data Sources click Virtual machines. Find your virtual machine and then click the name of the virtual machine.
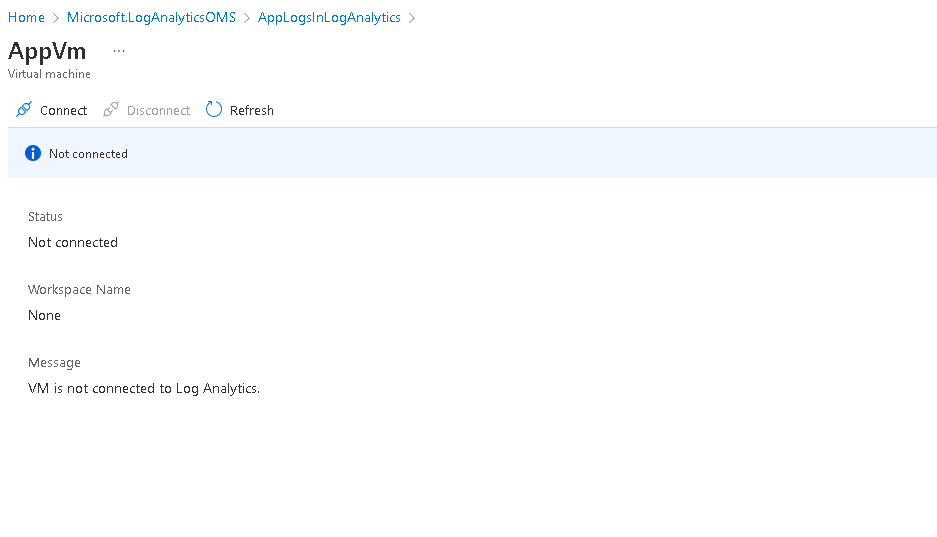
Click the Connect button.
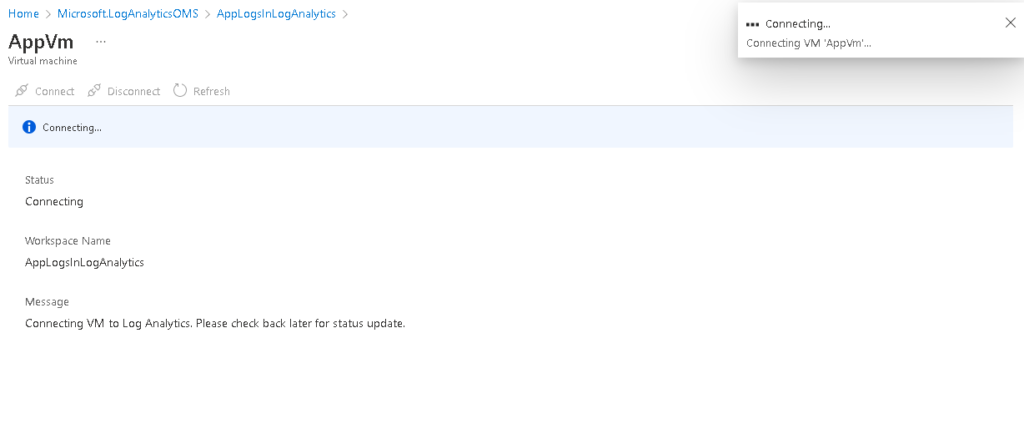
It will show as Connecting. Give it a few minutes.
Once connected, it will show the green check box and word This workspace written in front of the virtual machine name. This means that the Agent running on the virtual machine has been connected and configured to send logs to to this Log Analytics workspace.
Query Log Analytics
Give it a good 30 minutes to start initial ingestion (Important!.)
Now let’s test to see if the logs are flowing in:
appevents_CL
| where TimeGenerated < ago(1000d)
| take 10
And here are the results.

That’s great news, now lets try some analytical queries
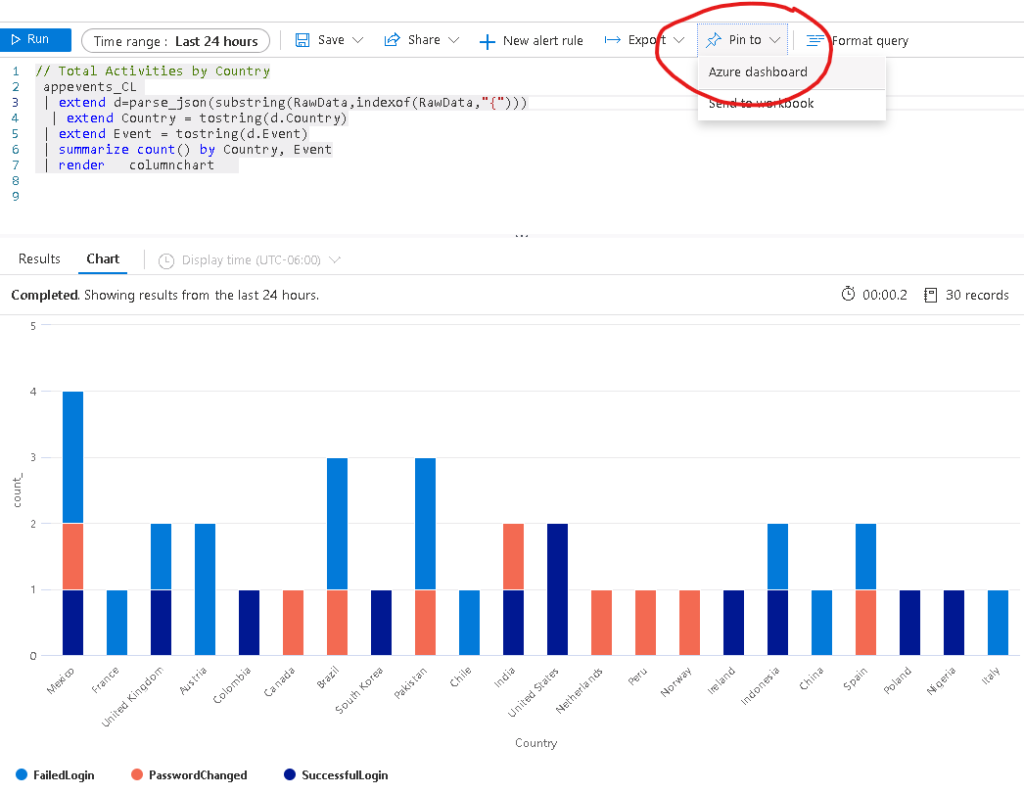
// Total Activities by Country
 appevents_CL
 | extend d=parse_json(substring(RawData,indexof(RawData,"{")))
  | extend Country = tostring(d.Country)
 | extend Event = tostring(d.Event)
 | summarize count() by Country, Event
 | render   columnchart
Here is the output

It all works fine. Let’s move to the next phase of creating Dashboard out of these queries.
Create Azure Dashboards from Log Analytics Queries
From the previous query, click the Pin to -> Azure Dashboard from menu.
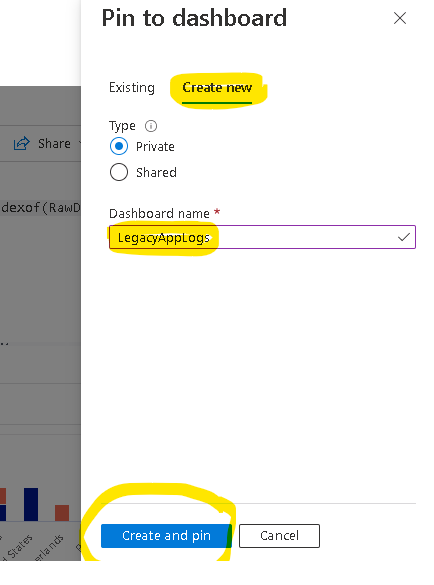
Once created, navigate to Dashboard on the left hand side and pick the dashboard.

And now you have a dashboard with your query
Next, I am going to create few more independent visualizations out of my sample data using these queries.
//Unique Logins Per Day
appevents_CL
| extend d=parse_json(substring(RawData,indexof(RawData,"{")))
| extend UserName = tostring(d.UserName)
| where d.Event == "SuccessfulLogin"
| summarize TotalUsers = dcount(UserName) by Date = bin (TimeGenerated,1d)
| render  columnchart


//Total Logins Per Hour
appevents_CL
| extend d=parse_json(substring(RawData,indexof(RawData,"{")))
| extend UserName = tostring(d.UserName)
| where d.Event == "SuccessfulLogin"
| summarize TotalLogins = count() by Hours=bin (TimeGenerated,1h)
| render      timechart

//Unique Logins By User Per Hour
appevents_CL
| extend d=parse_json(substring(RawData,indexof(RawData,"{")))
| extend UserName = tostring(d.UserName)
| where d.Event == "SuccessfulLogin"
| summarize count() by bin (TimeGenerated, 1h), UserName
| render   columnchart

// Total Activities by Type
appevents_CL
| extend d=parse_json(substring(RawData,indexof(RawData,"{")))
| extend Country = tostring(d.Country)
| extend Event = tostring(d.Event)
| summarize count() by Event
| render   piechart


//Total Successful Login By Country
appevents_CL
| extend d=parse_json(substring(RawData,indexof(RawData,"{")))
| extend Country = tostring(d.Country)
| where d.Event == "SuccessfulLogin"
| summarize count() by Country
| render   piechart
All I have to do is to create individual queries and pin to the existing Azure Dashbaord
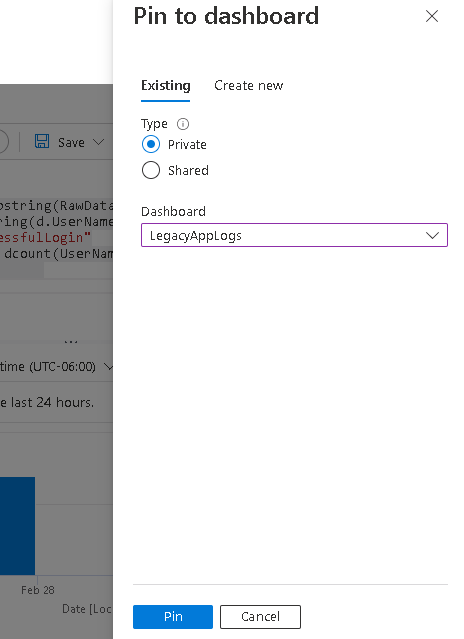
Once all done, you can open your dashboard and tile them on your Azure Dashboard per your needs by clicking the Edit button. (image linked to larger image opens in new window)
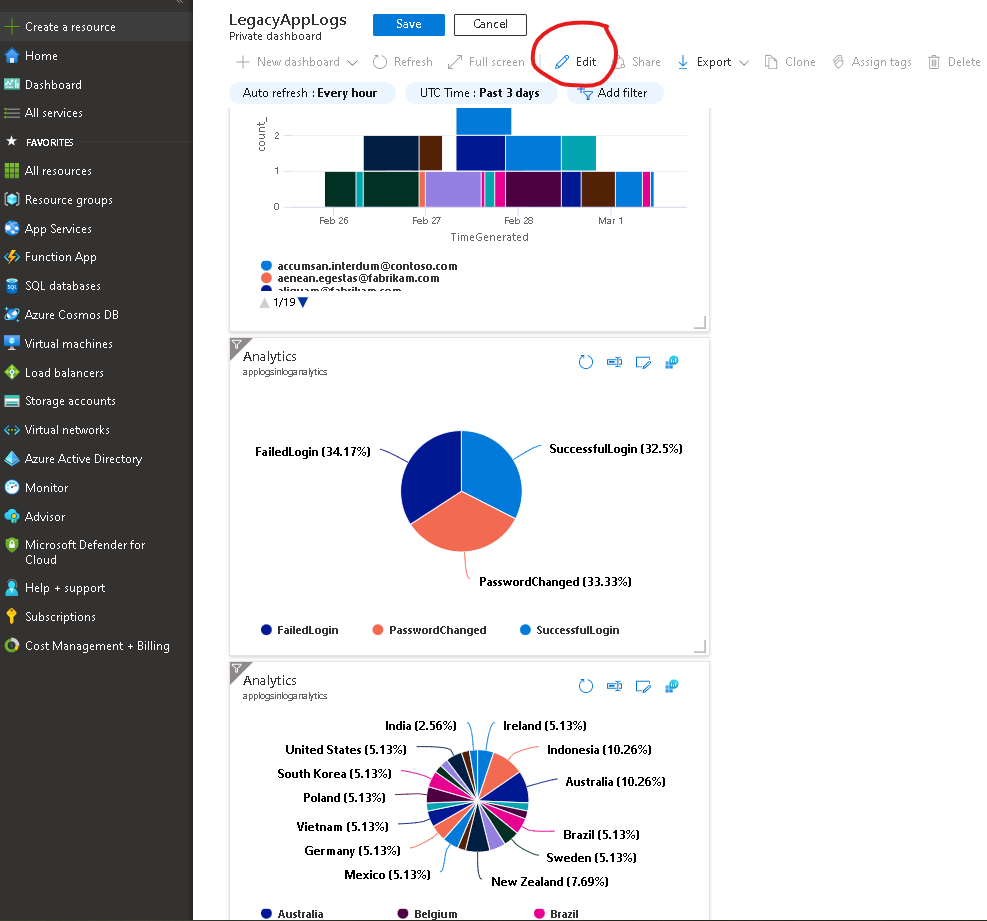
Here’s the dashboard without titles, so now lets add the titles. Click the button in Red Circle (image linked to larger image opens in new window)
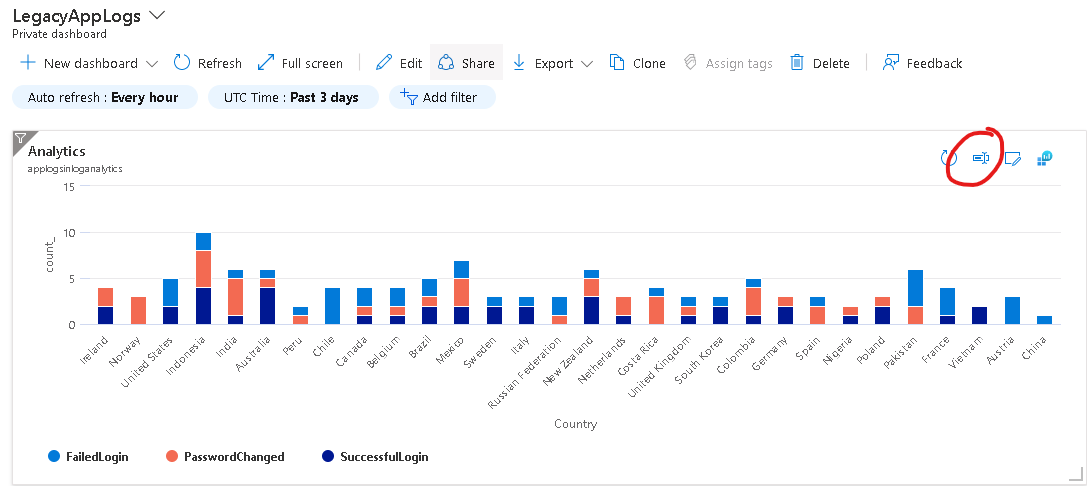
Update the title
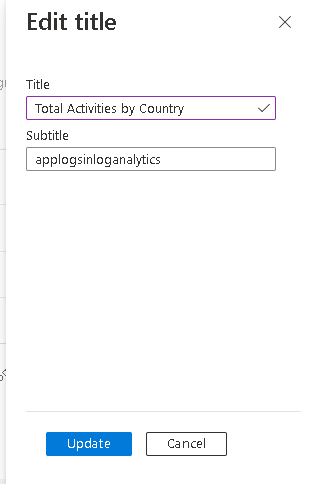
And here’s the final version of the Azure Dashboard (image linked to larger image opens in new window)
Create Alerts from Log Analytics Queries
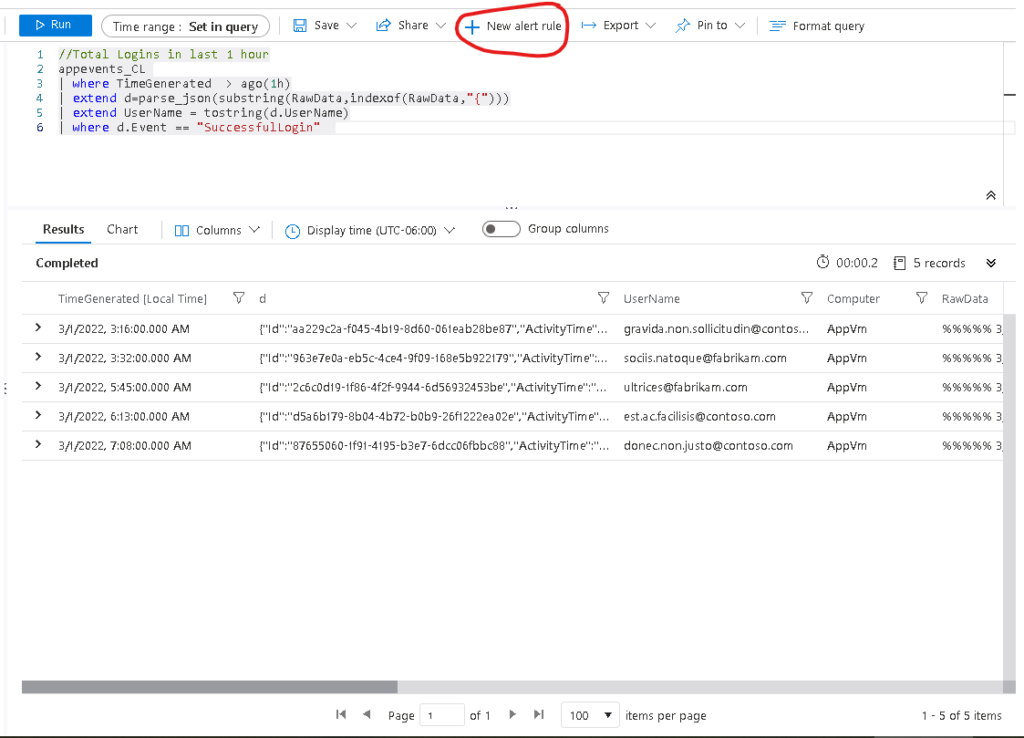
Similarly, you can create alerts based on alert criteria from your log analytics queries. One use case I can think of our sample dataset is to alert when the total logins per hour exceeds a defined threshold. In specific terms, if logins within the last 1 hour is more than 100, then alert. The query should be
//Total Logins in last 1 hour
appevents_CL
| where TimeGenerated > ago(1h)
| extend d=parse_json(substring(RawData,indexof(RawData,"{")))
| extend UserName = tostring(d.UserName)
| where d.Event == "SuccessfulLogin"
Then click the New alert rule button
Then specify the alert settings, specifically these two highlighted settings.
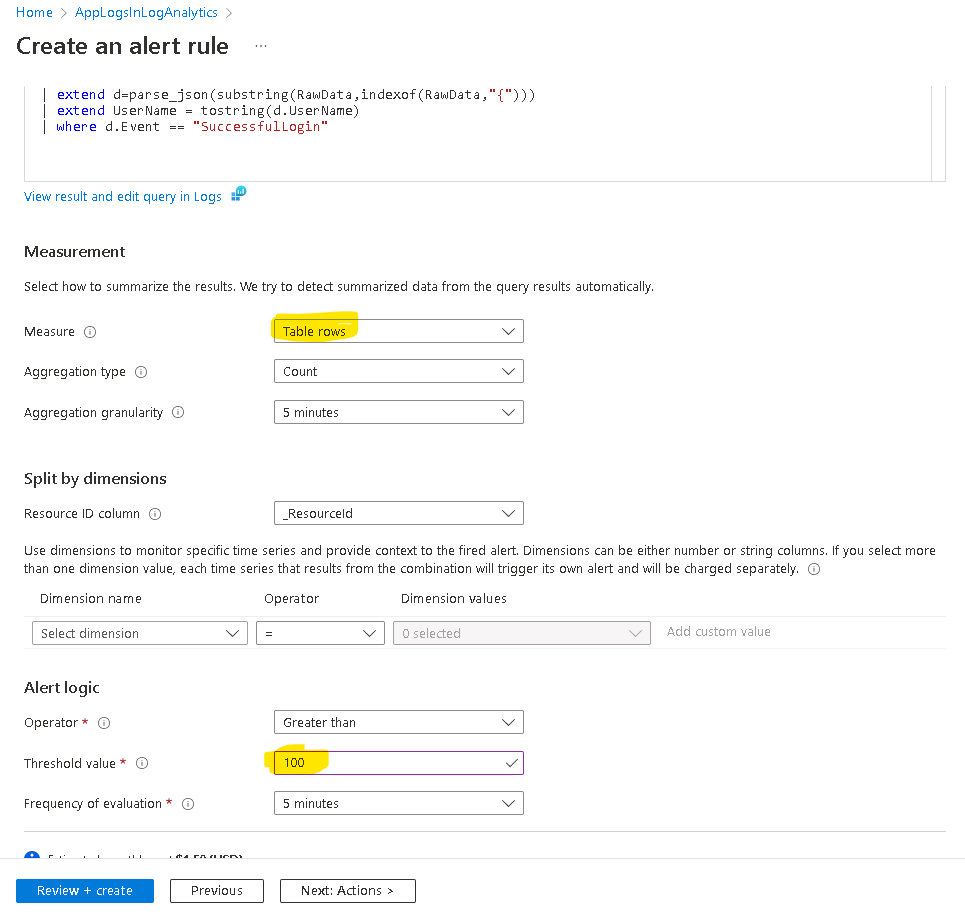
And Create the alert, and you’re done.
Download the solution and samples
Sample data and queries can be downloaded from GitHub.