Monitoring VMs without agent in today’s cloud-agnostic multi-cloud generation is every DevOps team dream. Agentless VM monitoring is technique and a migration path to consider of temporarily moving and testing waters on Azure while you transition your workload from AWS or GCP. By following this migration path, you’ll not be installing anything Microsoft-specific on your VMs (i.e. VHDs), while testing out Azure, and you can take your time to decide whether you want to continue with Azure.
Table of Contents
Agentless, Uber Lean Virtual Machine Monitoring
You don’t have to install anything on your Virtual Machine. This means that this will not take up any storage space – not even for logs on the VM, will not generate network traffic from the VM, will not take CPU time on the VM, will not consume memory! Nothing! Uber Lean.
Setting up Agentless Monitoring is Non-Invasive Operation
When you setup agentless monitoring, you are essentially not touching the Virtual Machine in any invasive manner. Yo do not even need to login to the VM. No reboot is required, no setting updates are required. Nothing. PS: There will be an activity log generated that you modified diagnostic settings.
Where is the source of truth coming from?
Agentless monitoring is all about monitoring the Host OS. Which means we’re monitoring the metrics being collected by the VM Host server hosting our Virtual Machine. In Azure language, these are called platform metrics. This is the link to documentation listing out all the metrics supported by agentless monitoring.
Agent-based monitoring is all about monitoring a VM from within the VM. This can also be called Guest OS monitoring where the agent is running within the VM and have visibility to all the processes the VM is running, their CPU time, memory consumption, and so on. These are called Guest OS metrics in the Azure lingo.
It will do ya’ll but not all
Agentless and agent-based monitoring have its own differences, as listed in this table:
| Metric | Agentless Monitoring | Agent-Based Monitoring |
| Network In/Out/Total Bytes | Yes | Yes |
| CPU Percentage | Yes | Yes |
| Disk Read/Write Ops / Second | Yes | Yes |
| Disk Read/Write Bytes / Second | Yes | Yes |
| Memory Allocation to the VM ( e.g. 4GB) | Yes | Yes |
| Memory Utilization by the VM (e.g. 1.5GB out of 4GB) | – | Yes |
| Seeing which process is taking CPU | – | Yes |
| Seeing which process is taking Memory | – | Yes |
Step 1: Create (if not exist) a Log Analytics workspace
If you have never created a Log Analytics workspace before, here’s the documentation.
Once done, you’ll need the Resource ID from Properties page of the Log Analytics workspace.
Step 2: Create (if not exist) a Virtual Machine
If you have never created a virtual machine in Azure before, here is the documentation.
Once done, you’ll need the Resource ID from Properties page of the Virtual Machine.
Step 3: Enable Agentless Monitoring
The agentless monitoring of Virtual Machiens cannot be turned on from Azure Portal. This is the documentation to the cmdlet, here is what you need to run the code below:
ResourceId is the Resource ID of the Virtual Machine that you want to enable agentless monitor for.
workspaceId is the Resource ID of the Log Analytics workspace, not the Workspace ID (GUID)
Here’s an example:
Set-AzDiagnosticSetting -Name vm-diagnostics -ResourceId "/subscriptions/xxxxxxxx-xxxx-xxxx-xxxx-xxxxxxxxxxxx/resourceGroups/my-resource-group/providers/Microsoft.Compute/virtualMachines/my-vm" -Enabled $true -MetricCategory AllMetrics -workspaceId "/subscriptions/xxxxxxxx-xxxx-xxxx-xxxx-xxxxxxxxxxxx/resourcegroups/my-resource-group/providers/microsoft.operationalinsights/workspaces/my-workspace"
After running the cmdlet, you will see output similar to this:
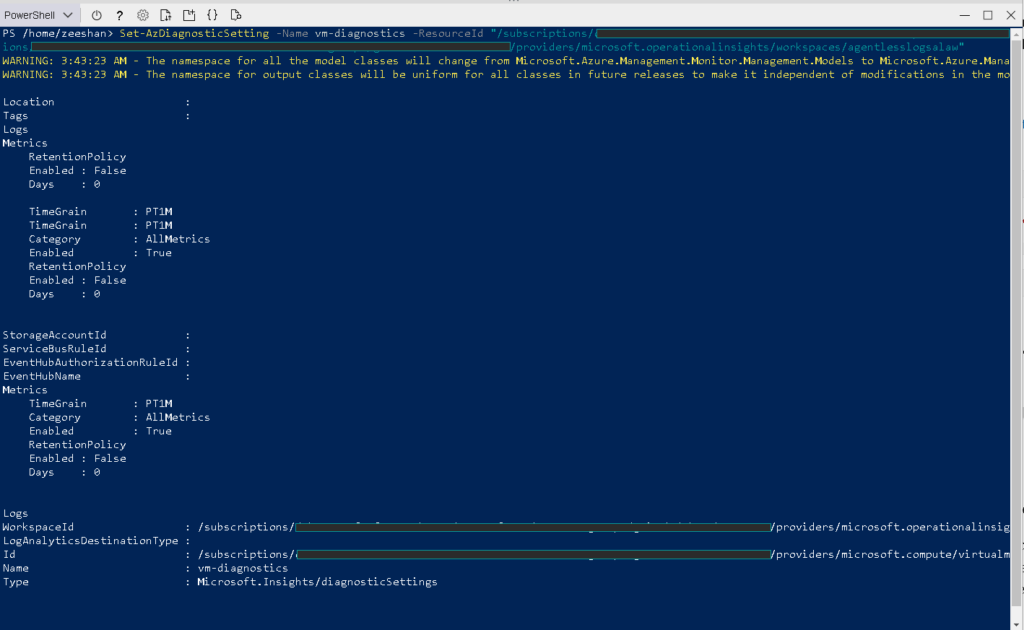
This means the Diagnostic Settings have been enabled and the Azure Host OS of the VM is now sending logs to the given Log Analytics workspace.
Step 4: Verify Azure Log Analytics Workspace for incoming logs
Note: Give it a good waiting time of 10-30 minutes before starting to see the metrics in Azure. Once started, the flow will be at PT1M time grain as specified above.
As part of the demo, I produced artificial CPU stress on the VM so we have interesting data to capture.
You can open your Log Analytics workspace and go to the Logs query runner and execute the following query to capture metrics.
AzureMetrics
| where ResourceProvider contains "compute" and MetricName == "Percentage CPU"
| project TimeGenerated, Maximum
| sort by TimeGenerated desc
| render columnchart
Here is the query window along with results in form of a column chart.
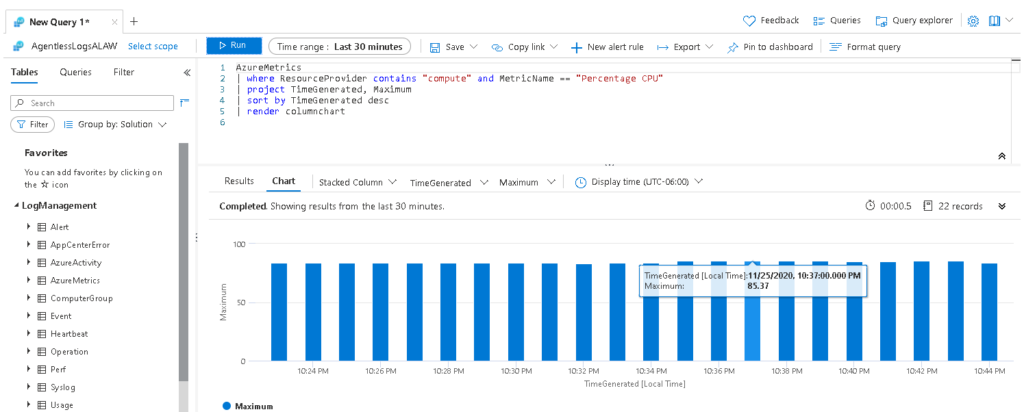
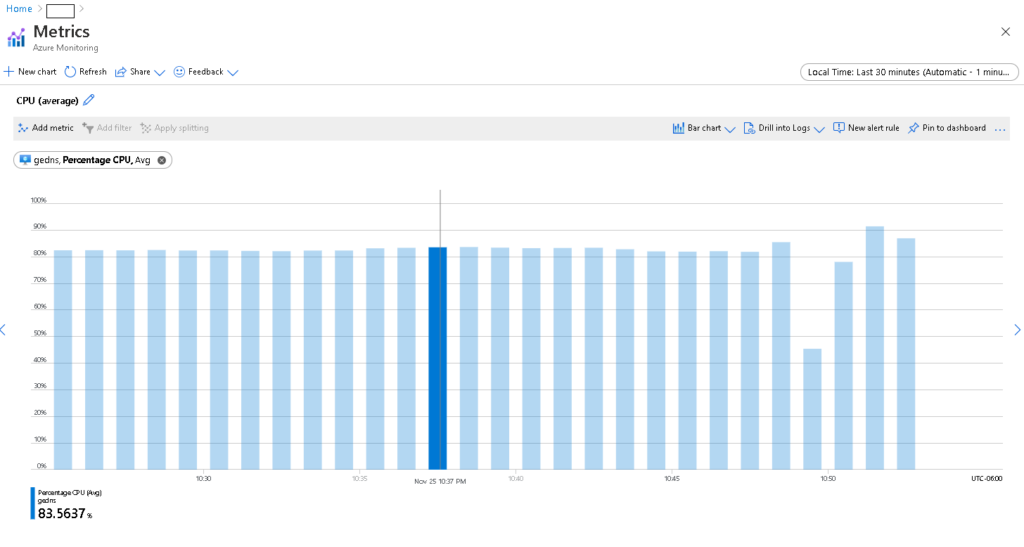
In the above Log Analytics results, we can see that the CPU utilization is at around 80%~ mark. Let’s cross-verify it in the Azure Metrics of this VM:
… to Summarize
Agentless VM monitoring is a non-invasive option when migrating Virtual Machine workloads to Azure. It allows you to capture (and produce alerting on top of) essential metrics about your virtual machine like CPU Consumption, Network IO, Disk IO and so. Once the agentless monitoring has been configured, you can configure smart alerting based on your Log Analytics workspace, giving you visibility to your infrastructure hosted in Azure. You can create workbooks, triggers, monitoring dashboards and so on.
Agentless VM monitoring is technique and a migration path to consider of temporarily moving and testing waters on Azure while you transition your workload from AWS or GCP. By following this migration path, you’ll not be installing anything Microsoft-specific on your VMs (i.e. VHDs), while testing out Azure, and you can take your time to decide whether you want to continue with Azure.